Regardless of whether you are a novice or expert trader, it’s imperative that you create a trading strategy prior to risking your capital. You can use several different techniques but should choose a methodology that fits your trading style. You can use mean-reverting strategies, momentum strategies or a strategy that employs support and resistance. In addition, you should define your risk and work it into your trading strategy prior to risking real capital.
Defining Your Trading Style
Before you pick a technical indicator to help you create your trading strategy, you should define your trading style. Do you like to pick a bottom and find value when everyone else is going in a different direction or do you like to ride the wave of momentum? Do you like to find a trend, or are you more comfortable with short-term movements? Each technical indicator helps provide a specific change in the value of an asset. For example, if you like mean-reversion where prices bounce from an overextended price, you might consider the Bollinger band strategy. If you like momentum, the MACD might be your best bet. If you like to catch a trend, then a moving average crossover strategy could be best.
Bollinger Band Strategy
Bollinger bands were created by John Bollinger. The help determines if the price of an asset is overextended. The Bollinger band high and Bollinger band low, encapsulate a 2-standard deviation range around the 20-day moving average. You can customize the range as well as the moving average to fit your needs. The chart shows you that when the exchange rate of the EUR/USD reaches the Bollinger band high it generally reverts back to the mean (the 20-day moving average). When the exchange rate hits the Bollinger band low, it is generally overextended on the downside and will likely rebound to the mean. This is a mean-reverting strategy.
Momentum
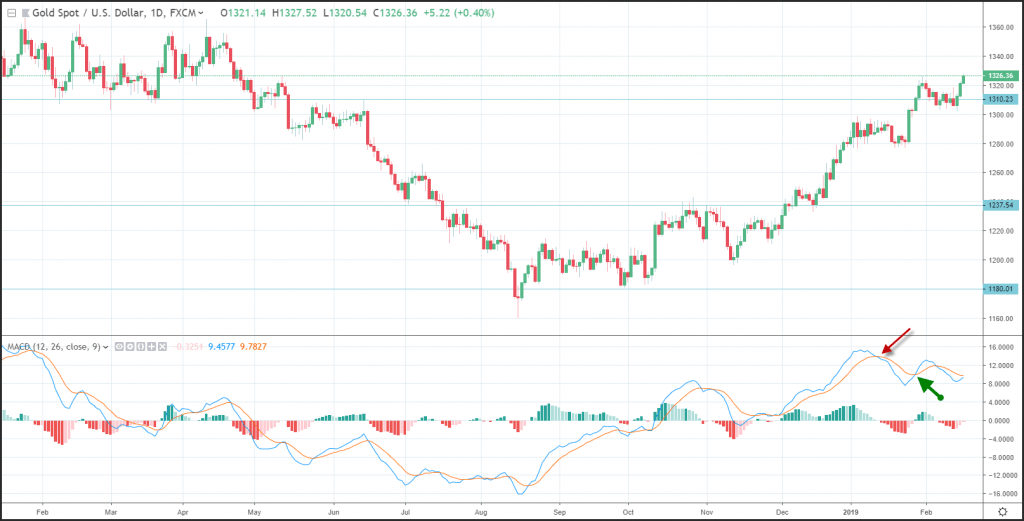
Momentum means that prices are accelerating or decelerating. If you want to catch the acceleration in prices or the decelerating in prices you can use the MACD (moving average convergence divergence) index. The MACD was created by Gerald Appel in the 1970s.
The MACD has several signals. The most popular is the crossover buy and sell signal. When the MACD line (the 12-day moving average minus the 26-day moving average) crosses above the MACD signal line a buy signal is generated. When the MACD line crosses below the MACD signal line a sell signal is created.
Trend Following
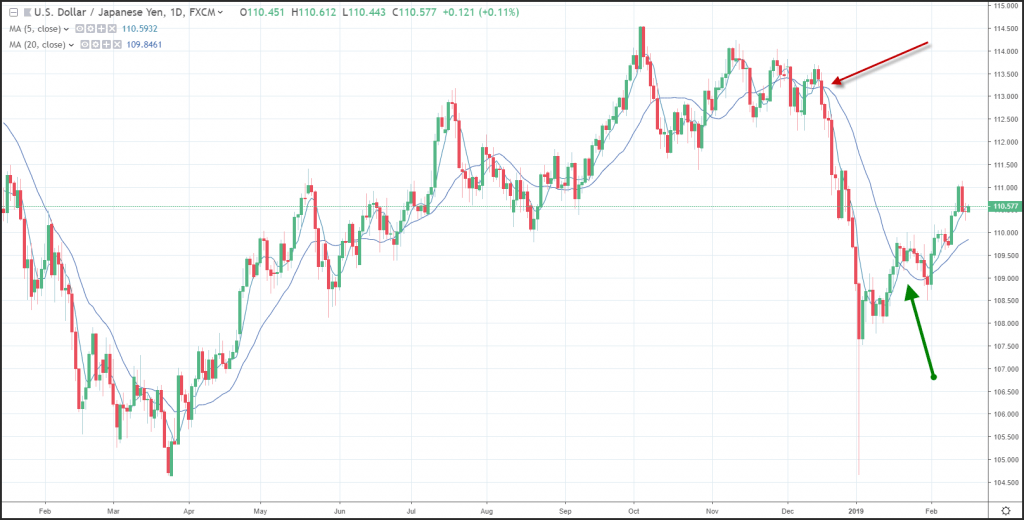
If you are looking to catch a trend, you can use a crossover buy or sell signal. The pros of a trend are that they generally continue to perpetuate. The cons of trend following are that a trend only occurs 33% of the time and most the rest of the time the markets are choppy.
A trend following strategy is when a short term moving average (such as the 5-day moving average) crosses above or below a longer-term moving average, such as the 20-day moving average.
Summary
Before risking your capital you should develop a strategy that fits your trading style. You can find technical indicator that will fit a mean-reversion style, a momentum style or trend following style. Prior to placing a trade, make sure you have a risk management plan in place.


